> For the complete documentation index, see [llms.txt](https://guide.vico.patrykandpatrick.com/llms.txt). Markdown versions of documentation pages are available by appending `.md` to page URLs; this page is available as [Markdown](https://guide.vico.patrykandpatrick.com/cartesian-charts/linecartesianlayer.md).
# LineCartesianLayer
Use [`LineCartesianLayer`](https://api.vico.patrykandpatrick.com/vico/compose/com.patrykandpatrick.vico.compose.cartesian.layer/-line-cartesian-layer/) to create line charts. Instantiate it via [`rememberLineCartesianLayer`](https://api.vico.patrykandpatrick.com/vico/compose/com.patrykandpatrick.vico.compose.cartesian.layer/remember-line-cartesian-layer.html).
Each line is associated with a [`Line`](https://api.vico.patrykandpatrick.com/vico/compose/com.patrykandpatrick.vico.compose.cartesian.layer/-line-cartesian-layer/-line/) instance. Create these via [`rememberLine`](https://api.vico.patrykandpatrick.com/vico/compose/com.patrykandpatrick.vico.compose.cartesian.layer/remember-line.html). These are provided by [`LineProvider`](https://api.vico.patrykandpatrick.com/vico/compose/com.patrykandpatrick.vico.compose.cartesian.layer/-line-cartesian-layer/-line-provider/). A base implementation of this interface can be instantiated via [`LineProvider.series`](https://api.vico.patrykandpatrick.com/vico/compose/com.patrykandpatrick.vico.compose.cartesian.layer/-line-cartesian-layer/-line-provider/-companion/series.html). You can customize line fills, backgrounds, shapes, and other properties. You can also add data labels, points, and interpolation.
## Animation
Line animations are configured via [`CartesianLayerDrawingModelInterpolator.line`](https://api.vico.patrykandpatrick.com/vico/compose/com.patrykandpatrick.vico.compose.cartesian.data/-cartesian-layer-drawing-model-interpolator/-companion/line.html). By default, a line grows from the baseline and fades in during its initial animation. Set `sweep` to `true` to instead animate the initial appearance as a clip sweeping in from the start edge:
```kt
rememberLineCartesianLayer(
drawingModelInterpolator = CartesianLayerDrawingModelInterpolator.line(sweep = true),
/* ... */
)
```
## `LineStroke`
Line strokes are customized via [`LineStroke`](https://api.vico.patrykandpatrick.com/vico/compose/com.patrykandpatrick.vico.compose.cartesian.layer/-line-cartesian-layer/-line-stroke/), which has two implementations:
* [`Continuous`](https://api.vico.patrykandpatrick.com/vico/compose/com.patrykandpatrick.vico.compose.cartesian.layer/-line-cartesian-layer/-line-stroke/-continuous/)
* [`Dashed`](https://api.vico.patrykandpatrick.com/vico/compose/com.patrykandpatrick.vico.compose.cartesian.layer/-line-cartesian-layer/-line-stroke/-dashed/)
## `LineFill` and `AreaFill`
Line fills are customized via [`LineFill`](https://api.vico.patrykandpatrick.com/vico/compose/com.patrykandpatrick.vico.compose.cartesian.layer/-line-cartesian-layer/-line-fill/), which has two factory functions:
* [`single`](https://api.vico.patrykandpatrick.com/vico/compose/com.patrykandpatrick.vico.compose.cartesian.layer/-line-cartesian-layer/-line-fill/-companion/single.html)
* [`double`](https://api.vico.patrykandpatrick.com/vico/compose/com.patrykandpatrick.vico.compose.cartesian.layer/-line-cartesian-layer/-line-fill/-companion/double.html)
Area fills, which are optional, are customized via [`AreaFill`](https://api.vico.patrykandpatrick.com/vico/compose/com.patrykandpatrick.vico.compose.cartesian.layer/-line-cartesian-layer/-area-fill/). This has similar factory functions to `LineFill`:
* [`single`](https://api.vico.patrykandpatrick.com/vico/compose/com.patrykandpatrick.vico.compose.cartesian.layer/-line-cartesian-layer/-area-fill/-companion/single.html)
* [`double`](https://api.vico.patrykandpatrick.com/vico/compose/com.patrykandpatrick.vico.compose.cartesian.layer/-line-cartesian-layer/-area-fill/-companion/double.html)
These cover most use cases. You can use both colors and brushes, and you can apply split styling—enabling you to create a line that’s green for positive values and red for negative values, for instance. You can, however, also create your own `LineFill` and `AreaFill` implementations.
[`LineFill.colorScale`](https://api.vico.patrykandpatrick.com/vico/compose/com.patrykandpatrick.vico.compose.cartesian.layer/-line-cartesian-layer/-line-fill/-companion/color-scale.html) and [`AreaFill.colorScale`](https://api.vico.patrykandpatrick.com/vico/compose/com.patrykandpatrick.vico.compose.cartesian.layer/-line-cartesian-layer/-area-fill/-companion/color-scale.html) provide another option. These APIs let you define multi-stop styling against the value scale instead of splitting at a single threshold.
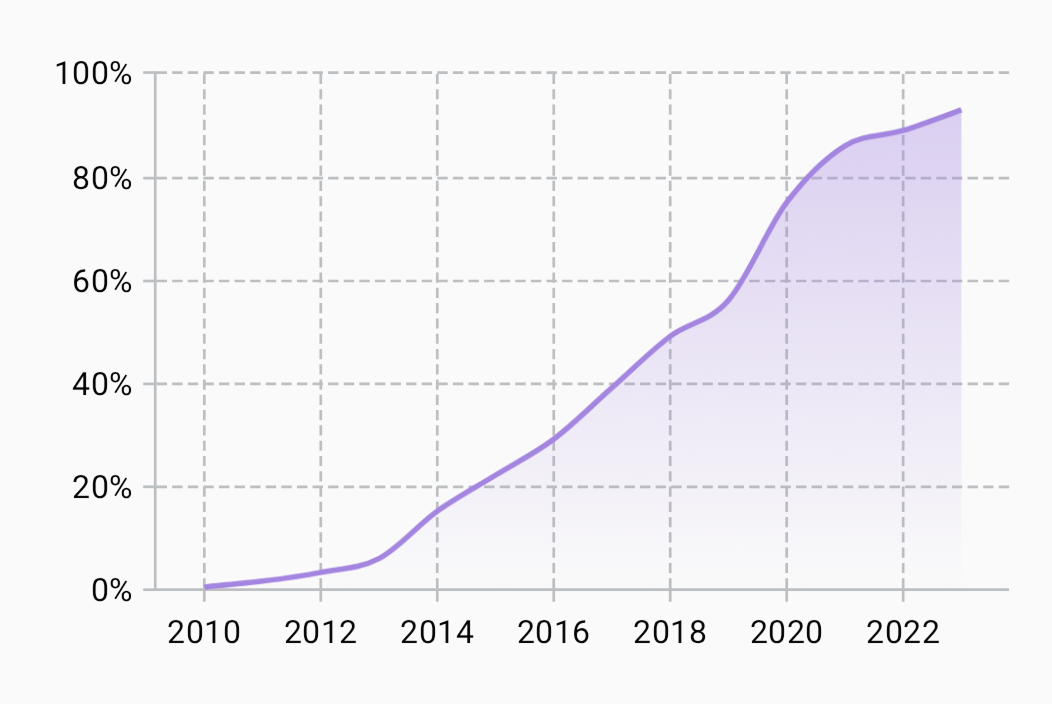
For an example of an area fill, see the [“Electric-car sales (Norway)”](https://github.com/patrykandpatrick/vico/blob/stable/sample/shared/src/commonMain/kotlin/com/patrykandpatrick/vico/sample/charts/ElectricCarSales.kt) sample chart.
## `Interpolator`
Use [`Interpolator`](https://api.vico.patrykandpatrick.com/vico/compose/com.patrykandpatrick.vico.compose.cartesian.layer/-line-cartesian-layer/-interpolator/) to define how a line passes through its points. Three built-in implementations are available:
* [`Sharp`](https://api.vico.patrykandpatrick.com/vico/compose/com.patrykandpatrick.vico.compose.cartesian.layer/-line-cartesian-layer/-interpolator/-companion/-sharp.html) uses straight line segments.
* [`cubic`](https://api.vico.patrykandpatrick.com/vico/compose/com.patrykandpatrick.vico.compose.cartesian.layer/-line-cartesian-layer/-interpolator/-companion/cubic.html) uses cubic Bézier curves.
* [`catmullRom`](https://api.vico.patrykandpatrick.com/vico/compose/com.patrykandpatrick.vico.compose.cartesian.layer/-line-cartesian-layer/-interpolator/-companion/catmull-rom.html) passes through all points and keeps collinear segments straight.
The [“Electric-car sales (Norway)”](https://github.com/patrykandpatrick/vico/blob/stable/sample/shared/src/commonMain/kotlin/com/patrykandpatrick/vico/sample/charts/ElectricCarSales.kt) sample chart uses `catmullRom`.
## `PointProvider`
To add points, use [`PointProvider`](https://api.vico.patrykandpatrick.com/vico/compose/com.patrykandpatrick.vico.compose.cartesian.layer/-line-cartesian-layer/-point-provider/). [`PointProvider.single`](https://api.vico.patrykandpatrick.com/vico/compose/com.patrykandpatrick.vico.compose.cartesian.layer/-line-cartesian-layer/-point-provider/-companion/single.html) instantiates a base implementation that adds a point for each entry and uses a shared point style. Once again, custom implementations can be created. A common use case for this is styling points individually based on their *y*-values. For an example, see the [“AI test scores”](https://github.com/patrykandpatrick/vico/blob/stable/sample/shared/src/commonMain/kotlin/com/patrykandpatrick/vico/sample/charts/AITestScores.kt) sample chart.
## `Transaction.lineModel`
Line layers use [`LineCartesianLayerModel`](https://api.vico.patrykandpatrick.com/vico/compose/com.patrykandpatrick.vico.compose.cartesian.data/-line-cartesian-layer-model/) instances. When using [`CartesianChartModelProducer`](https://api.vico.patrykandpatrick.com/vico/compose/com.patrykandpatrick.vico.compose.cartesian.data/-cartesian-chart-model-producer/), add them via [`lineModel`](https://api.vico.patrykandpatrick.com/vico/compose/com.patrykandpatrick.vico.compose.cartesian.data/line-model.html):
```kt
cartesianChartModelProducer.runTransaction {
lineModel {
series(1, 8, 3, 7)
series(y = listOf(6, 1, 9, 3))
series(x = listOf(1, 2, 3, 4), y = listOf(2, 5, 3, 4))
}
// ...
}
```
Each [`series`](https://api.vico.patrykandpatrick.com/vico/compose/com.patrykandpatrick.vico.compose.cartesian.data/-line-cartesian-layer-model/-builder-scope/series.html) invocation adds a series to the `LineCartesianLayerModel` instance. Above, three series are added. `series` has three overloads (each of which accepts all `Number` subtypes):
* a `vararg` overload that takes *y*-values and uses their indices as the *x*-values
* an overload that takes a collection of *y*-values and uses their indices as the *x*-values
* an overload that takes a collection of *x*-values and a collection of *y*-values of the same size
## Manual `LineCartesianLayerModel` creation
When creating a [`CartesianChartModel`](https://api.vico.patrykandpatrick.com/vico/compose/com.patrykandpatrick.vico.compose.cartesian.data/-cartesian-chart-model/) instance directly, you can add a line-layer model by using [`build`](https://api.vico.patrykandpatrick.com/vico/compose/com.patrykandpatrick.vico.compose.cartesian.data/-line-cartesian-layer-model/-companion/build.html). This function gives you access to the same DSL that `lineModel` does.
```kt
CartesianChartModel(
LineCartesianLayerModel.build {
series(1, 8, 3, 7)
series(y = listOf(6, 1, 9, 3))
series(x = listOf(1, 2, 3, 4), y = listOf(2, 5, 3, 4))
},
// ...
)
```
---
# Agent Instructions
This documentation is published with GitBook. GitBook is the documentation platform designed so that both humans and AI agents can read, navigate, and reason over technical content effectively. Learn more at gitbook.com.
## Querying This Documentation
If you need additional information that is not directly available in this page, you can query the documentation dynamically by asking a question.
Perform an HTTP GET request on the current page URL with the `ask` query parameter, and the optional `goal` query parameter:
```
GET https://guide.vico.patrykandpatrick.com/cartesian-charts/linecartesianlayer.md?ask=&goal=
```
`ask` is the immediate question: it should be specific, self-contained, and written in natural language.
`goal` is optional and describes the broader end goal you are ultimately trying to accomplish on behalf of the user. GitBook uses it to tailor the answer towards what is most useful for that goal.
The response will contain a direct answer to the question and relevant excerpts and sources from the documentation.
Use this mechanism when the answer is not explicitly present in the current page, you need clarification or additional context, or you want to retrieve related documentation sections.