For the complete documentation index, see llms.txt. This page is also available as Markdown.

ColumnCartesianLayer

Use ColumnCartesianLayer to create column charts. Instantiate it via rememberColumnCartesianLayer.

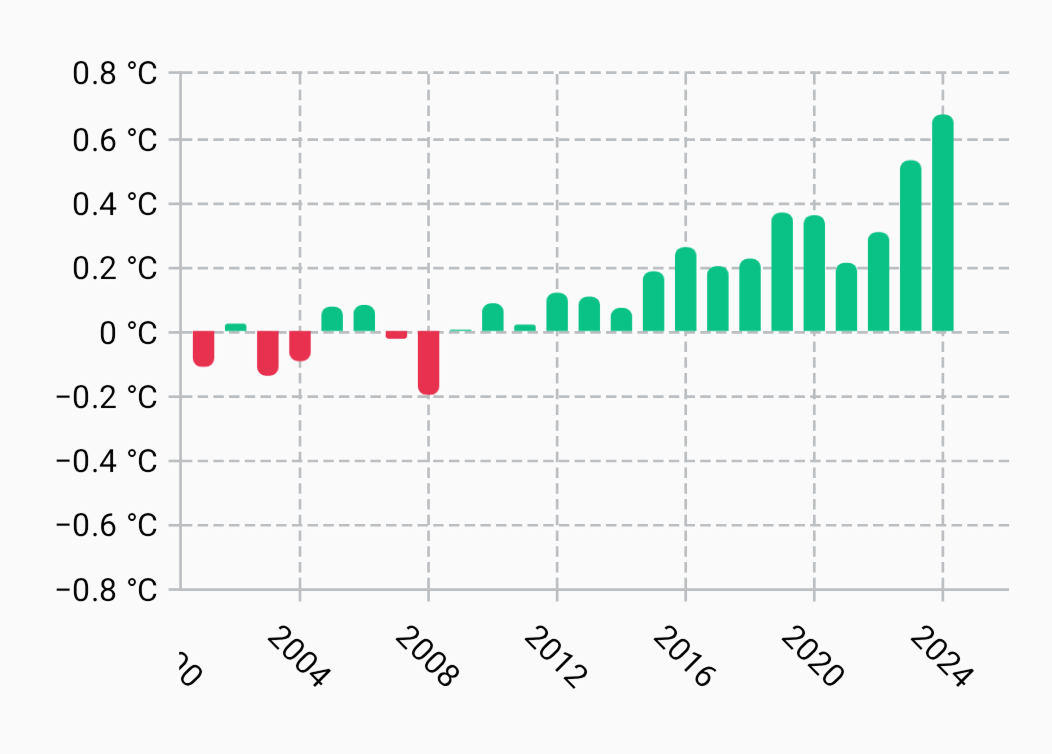
Columns are drawn via LineComponent instances provided by ColumnProvider. ColumnProvider.series creates a ColumnProvider instance that uses one LineComponent instance per series. You can create your own implementation for custom behavior, including styling columns individually based on their y-values, as in the “Temperature anomalies (June)” sample chart.

The “Temperature anomalies (June)” sample chart, which colors each column according to its y-value
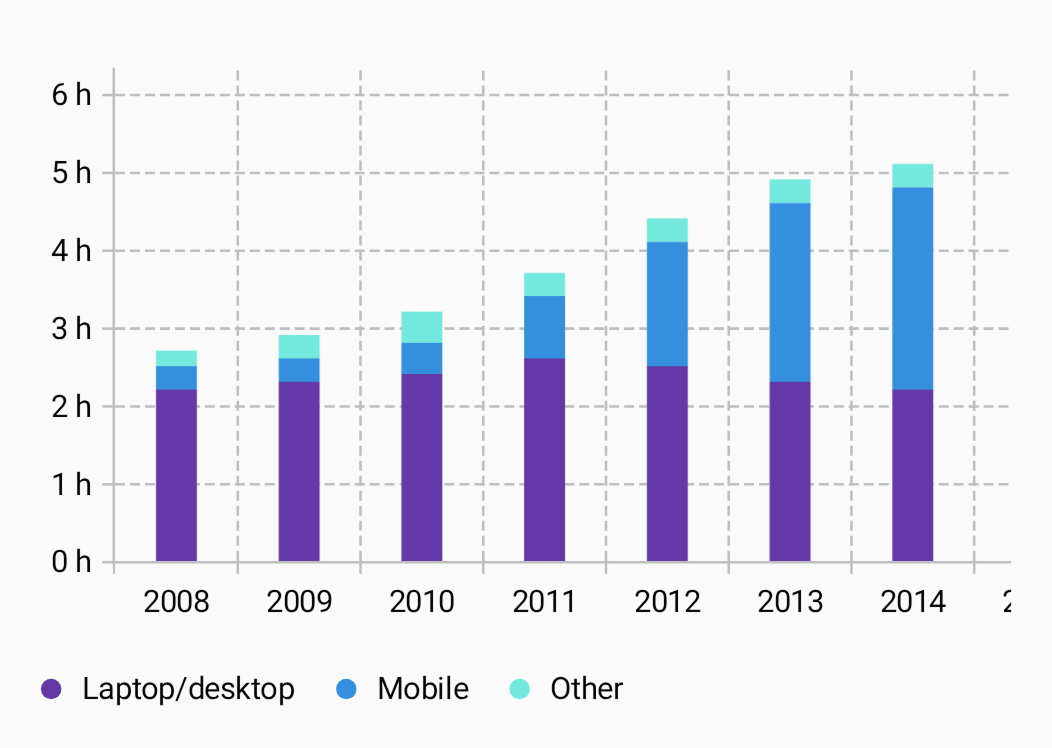
In rememberColumnCartesianLayer, you can also change column spacing. Data labels are supported. When multiple series are added, columns can be grouped horizontally or stacked. The “Daily digital-media use (USA)” sample chart uses stacking.

The “Daily digital-media use (USA)” sample chart, which stacks its column series

Transaction.columnModel

Column layers use ColumnCartesianLayerModel instances. When using CartesianChartModelProducer, add them via columnModel:

Each series invocation adds a series to the ColumnCartesianLayerModel instance. Above, three series are added. series has three overloads (each of which accepts all Number subtypes):

  • a vararg overload that takes y-values and uses their indices as the x-values

  • an overload that takes a collection of y-values and uses their indices as the x-values

  • an overload that takes a collection of x-values and a collection of y-values of the same size

Manual ColumnCartesianLayerModel creation

When creating a CartesianChartModel instance directly, you can add a column-layer model by using build. This function gives you access to the same DSL that columnModel does.

Last updated